A cluster-sizing spreadsheet that carries the headline “up to 5.7× faster on DeepSeek-R1” from the MLCommons release into a purchase order overstates what an enterprise can buy today by roughly a factor of 1.9. The ratio is real: recomputed from the official results sheet it is 5.65×[1]. But its numerator is a Vera Rubin NVL72 row labeled Preview, and its denominator is a system from a year earlier. Restrict both sides to hardware in the Available category and the gain is 3.04×. This article reads the MLPerf® Inference v6.1 Closed Datacenter results the way a procurement team has to: per accelerator, from Available systems, with the software stack kept in view.
Thesis: on gpt-oss-120b, the benchmark with the most submissions in this round according to the MLCommons chairs, an NVIDIA B300 and an AMD MI355X in 8-GPU form land 0.4% apart per GPU in the Server scenario, while a ROCm and PyTorch stack update gave AMD’s own 8-GPU system 37.9% more per-GPU Server throughput than it posted in MLPerf® Inference v6.0. Software maturity is therefore the largest controllable variable in the data, and a buying decision based on the vendor-against-vendor ranking optimizes the wrong variable. The defensible primitive is a break-even price ratio against a fixed baseline, re-derived every round and checked against the stack you will actually run.
Every figure below is either read directly from an official entry (cited by entry ID in the footnotes) or computed by us from those entries with the formula stated beside it. Per-GPU values divide a published system result by the published accelerator count; they are derived metrics, not official benchmark scores.[1] That distinction matters for the six vendor claims recomputed later in the article, where arithmetic holds in every case but framing does not always survive the Server-versus-Offline split.
Why the 5.7× DeepSeek-R1 headline in MLPerf® Inference v6.1 shrinks to 3.04× for Available hardware
The MLCommons release states that the best per-accelerator Server result on DeepSeek-R1 was 5.7× better than in v5.1 one year earlier. Our recomputation reproduces the claim exactly: the best v5.1 Server row (entry 5.1-0072, 72 accelerators, Available) delivers 2,907 tokens per second per accelerator, and the best v6.1 row (entry 6.1-0107, a Nebius VR200 NVL72 submission with 36 accelerators, Preview) delivers 16,427. The ratio is 5.65×, which rounds to the published 5.7×.[1][3]
The same arithmetic on the Offline scenario gives 2.74×, because the best v5.1 Offline row (6,006 per accelerator, entry 5.1-0097) was itself a Preview system and the best v6.1 Offline row (16,435, entry 6.1-0106) is Vera Rubin NVL72 in the same category. When both ends are Preview, the comparison is internally consistent but says little about what is deliverable this quarter. MLCommons describes these platforms as recently released or soon-to-be-released, which is the correct reading of the Preview label.
Procurement needs a different filter. Restricting both rounds to Available rows, the best v6.1 DeepSeek-R1 Server result is 8,846 per accelerator on an 8-GPU B300 system (entry 6.1-0046), against the same 2,907 baseline: 3.04×. For Offline, the Available-to-Available ratio is 1.65× (5,842 in entry 5.1-0072 to 9,629 in entry 6.1-0088, an 8-GPU GB300 system submitted by Oracle). Hardware generation, software tuning, and system scale all moved between those rows.
A team sizing capacity for delivery this quarter should discount the headline by the Preview share of the gain: the difference between 5.65× and 3.04× for Server DeepSeek-R1. A team whose contracts land after Rubin-class systems reach general availability should still read the Preview rows as an upper envelope, since the submitted configurations are tuned for the benchmark.
| Scenario | Comparison basis | v5.1 best (tokens/s per accelerator) | v6.1 best (tokens/s per accelerator) | Ratio |
|---|---|---|---|---|
| Server | Best row in any category | 2,907 72 GPUs · Available · 5.1-0072 | 16,427 36 GPUs · Preview · 6.1-0107 | 5.65× |
| Server | Available rows only | 2,907 72 GPUs · Available · 5.1-0072 | 8,846 8 GPUs · Available · 6.1-0046 | 3.04× |
| Offline | Best row in any category | 6,006 8 GPUs · Preview · 5.1-0097 | 16,435 72 GPUs · Preview · 6.1-0106 | 2.74× |
| Offline | Available rows only | 5,842 8 GPUs · Available · 5.1-0072 | 9,629 8 GPUs · Available · 6.1-0088 | 1.65× |
Source: MLCommons official results, v6.1 and v5.1 repositories, retrieved October 2, 2026; per-accelerator values and ratios are GPU Insights derived metrics.[1][3] Takeaway: the Available-only Server gain is 3.04×, not 5.7×.
Per-GPU throughput by accelerator: the shortlist that survives a spreadsheet
Aggregate throughput is the number vendors lead with because it scales with the size of the system. A 512-accelerator Crusoe submission reached 5.75 million tokens per second on gpt-oss-120b in the Offline scenario (entry 6.1-0027), and its per-GPU figure is 11,229. The best 8-GPU MI355X row from Dell on a comparable vLLM release (entry 6.1-0037) delivers 14,726 per GPU, so the 512-GPU system runs at 76.3% of the small system’s per-GPU rate. The aggregate headline is true and also useless for deciding how many GPUs a given workload needs.
The scenario matters as much as the scale. In the Server scenario, the load generator sends queries with Poisson arrivals and the system must keep time-to-first-token and time-per-output-token inside bounds; for gpt-oss-120b the inference rules set 3,000 ms and 80 ms. In the Offline scenario every sample is available at the start and the system reports pure throughput. Server numbers are the ones that map to an interactive service, so this article uses Server as the primary metric and reports Offline only where it changes an argument.
Two more constraints bound what a per-GPU number can mean. The rules state that MLPerf® Inference disallows caching queries, and a KV cache is permitted only within a single query, so production gains from cross-request prefix caching do not appear in these results. And the sheet reports a unit labeled tokens per second without further definition; we treat it as generated tokens per second, the convention for these language benchmarks, and flag that assumption in the limitations section.
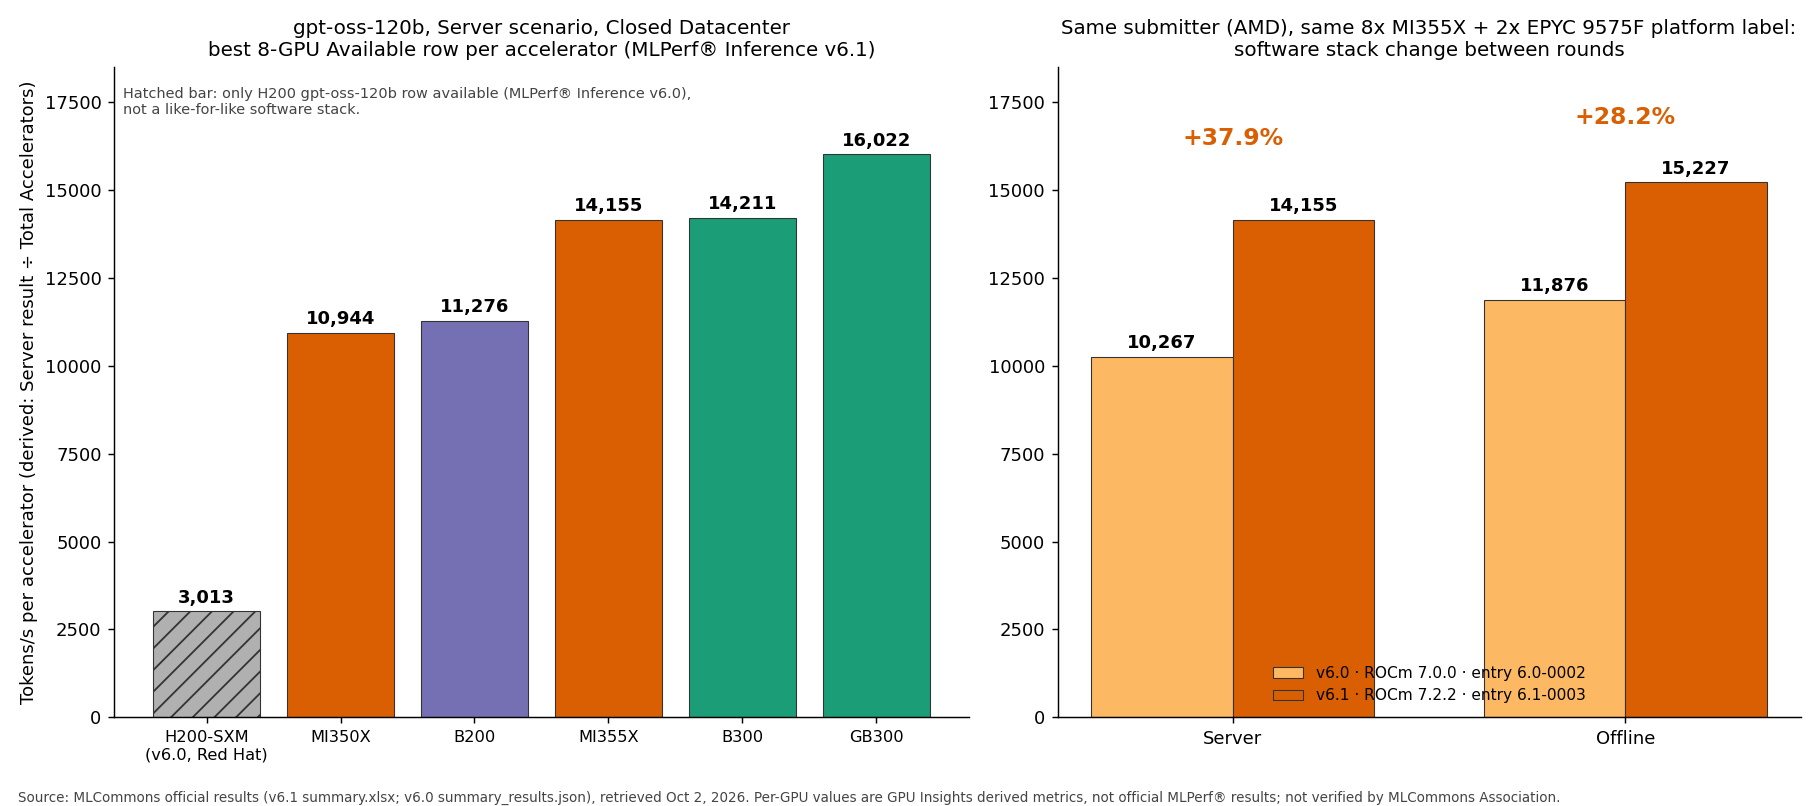
Table 1 lists the best Available Closed row per family and benchmark, with that row’s GPU count in the cell, since the best row is not always an 8-GPU system. The median of all Available gpt-oss-120b Server rows sits beneath the best value so one tuned submission does not stand in for the family.
| Accelerator | gpt-oss-120b Server | gpt-oss-120b Offline | Llama2-70b-99.9 Server | DeepSeek-R1 Server |
|---|---|---|---|---|
| NVIDIA GB300 | 16,118 72 GPUs · 6.1-0025 median of 9 rows: 15,565 | 16,635 72 GPUs · 6.1-0025 | 15,998 8 GPUs · 6.1-0088 | 8,517 8 GPUs · 6.1-0088 |
| NVIDIA B300 | 14,211 8 GPUs · 6.1-0052 median of 16 rows: 13,417 | 14,321 8 GPUs · 6.1-0052 | 14,496 1 GPU · 6.1-0103 | 8,846 8 GPUs · 6.1-0046 |
| AMD MI355X | 14,155 8 GPUs · 6.1-0003 median of 10 rows: 13,634 | 15,227 8 GPUs · 6.1-0003 | 13,068 8 GPUs · 6.1-0069 | 4,698 512 GPUs · 6.1-0026 |
| NVIDIA GB200 | 12,774 4 GPUs · 6.1-0094 median of 5 rows: 12,589 | 15,301 4 GPUs · 6.1-0094 | 12,648 72 GPUs · 6.1-0023 | 5,928 72 GPUs · 6.1-0009 |
| NVIDIA B200 | 11,276 8 GPUs · 6.1-0021 median of 2 rows: 11,254 | 11,436 8 GPUs · 6.1-0021 | 12,800 8 GPUs · 6.1-0021 | 7,015 8 GPUs · 6.1-0021 |
| AMD MI350X | 10,944 8 GPUs · 6.1-0068 median of 1 rows: 10,944 | 12,127 8 GPUs · 6.1-0068 | 10,626 8 GPUs · 6.1-0068 | — |
| NVIDIA RTX PRO 6000 | 1,852 8 GPUs · 6.1-0013 median of 4 rows: 1,835 | 1,967 8 GPUs · 6.1-0082 | 3,665 8 GPUs · 6.1-0013 | — |
| NVIDIA H200-SXM reference, v6.0 | 3,013 8 GPUs · 6.0-0092 · MXFP4 · Red Hat LLM-D | 3,585 8 GPUs · 6.0-0092 | — | — |
Source: MLCommons official results, v6.1 repository (summary.xlsx) and v6.0 repository (summary_results.json), retrieved October 2, 2026; per-accelerator values are GPU Insights derived metrics.[1][2] Takeaway: only the GB300 and B300 rows clear 14,000 tokens/s per GPU on gpt-oss-120b Server among 8-GPU or smaller systems, and the MI355X row sits 0.4% below the B300 row.
Read the table by decision, not by rank. Among 8-GPU Available systems on gpt-oss-120b Server, the B300 best row (14,211, entry 6.1-0052) is 26.0% above the B200 row (11,276, entry 6.1-0021), the GB300 8-GPU row (16,022, entry 6.1-0075) is 42.1% above it, and the MI355X row (14,155, entry 6.1-0003) is 25.5% above it. The MI350X row (10,944, entry 6.1-0068) is 2.9% below B200. In Offline, the MI355X best row is 6.3% above the B300 best 8-GPU row, so the Server and Offline orderings of the two parts differ.
The H200 row is a warning about what the table cannot show. The only H200-only gpt-oss-120b entry in the v6.0 results ran Red Hat’s LLM-D stack with MXFP4 weights, and the B300 best row is 4.7× above it. That ratio mixes a hardware generation, a different serving stack, and a different submission round, so it supports one conclusion only: no comparable H200-only row exists in this round. The sole v6.1 gpt-oss-120b entry with H200 hardware is a heterogeneous H200 plus MI350X system (entry 6.1-0016), which a per-GPU division cannot interpret.
Software moved the MI355X 37.9% in six months; the B300-versus-B200 gap is 26.0%
The cleanest software-only comparison in the data comes from AMD itself. In MLPerf® Inference v6.0 AMD submitted gpt-oss-120b on an 8x MI355X system with two EPYC 9575F processors (entry 6.0-0002), running PyTorch 2.9.1 and ROCm 7.0.0. In v6.1 it submitted the same platform label on a host of the same chassis model (entry 6.1-0003), running PyTorch 2.10.0 and ROCm 7.2.2. Per-GPU Server throughput rose from 10,267 to 14,155, a gain of 37.9%, and Offline rose from 11,876 to 15,227, a gain of 28.2%.[1][2]
Lambda reports a smaller NVIDIA-side effect, and the arithmetic holds. Its 4x GB300 system moved from 53,463 to 58,196 tokens per second in Server, a gain of 8.85%, and from 60,220 to 65,512 in Offline, a gain of 8.79% (entries 6.0-0063 and 6.1-0065). Lambda states that the hardware is identical; the v6.0 row is listed under the submitter name Lambda_SIT with a different system label, so we verified the numbers and not the claim of hardware identity.[2]
Spread between submitters running the same silicon in the same round is smaller. Across the 14 Available 8-GPU B300 rows on gpt-oss-120b Server, per-GPU throughput ranges from 12,523 (entry 6.1-0091) to 14,211 (entry 6.1-0052), a 13.5% spread. Across the eight 8-GPU MI355X rows the range is 13,604 to 14,155, a 4.0% spread. Inside a round the same-silicon spread is 4% to 13%; across rounds a software update moved one system by 9% to 38%. Time-in-market of the software stack is a larger lever than vendor choice among current Blackwell-class and CDNA 4 parts.
CoreWeave’s GB300 NVL72 row shows why not every v6.0-to-v6.1 delta is software. CoreWeave reports per-GPU gains of 17% in Offline and 8% in Server; we recompute 16.9% and 7.8% (entries 6.0-0016 and 6.1-0025). But the v6.0 system used 64 GPUs and the v6.1 system uses 72, so scale and software are confounded.[2] The row is useful as a bound, not as a software measurement.
| System (submitter) | Server change | Offline change | Stack or configuration change | Like-for-like? |
|---|---|---|---|---|
| 8x MI355X + 2x EPYC 9575F (AMD) 6.0-0002 → 6.1-0003 | +37.9% 10,267 → 14,155 per GPU | +28.2% 11,876 → 15,227 per GPU | ROCm 7.0.0 → 7.2.2; PyTorch 2.9.1 → 2.10.0 | Yes, same platform label; different host of same chassis model |
| 4x GB300 (Lambda) 6.0-0063 → 6.1-0065 | +8.85% 13,366 → 14,549 per GPU | +8.79% 15,055 → 16,378 per GPU | TensorRT 10.14 → TensorRT-LLM 1.3.0rc14 | Per submitter; system labels differ |
| GB300 NVL72 (CoreWeave) 6.0-0016 → 6.1-0025 | +7.8% 14,946 → 16,118 per GPU | +16.9% 14,226 → 16,635 per GPU | 64 GPUs → 72 GPUs; stack versions differ | No, scale changed |
Source: MLCommons official results, v6.0 and v6.1 repositories, retrieved October 2, 2026; per-GPU values and percentage changes are GPU Insights derived metrics.[1][2] Takeaway: a software-only change moved per-GPU Server throughput by between 8.9% and 37.9% on the two like-for-like systems.
Six vendor claims recomputed from the official sheet, and where the framing breaks
MLCommons publishes submitter statements in a supplemental document and states that they do not reflect MLCommons’ views. We recomputed every claim that the public results allow. All six pass the arithmetic test, which is the expected outcome for statements that MLCommons-verified results back. The informative part is which scenario, category, and configuration each claim silently selects.
NVIDIA’s Vera Rubin claim of up to 2.5× on DeepSeek-R1 against the prior generation holds only for one scenario. Comparing the Vera Rubin NVL72 row (entry 6.1-0106, 72 accelerators, Preview) with NVIDIA’s GB300 NVL72 row of the same size (entry 6.1-0074), the per-accelerator ratios are 1.97× in Server, 1.74× in Offline, and 2.57× in Interactive. The claim matches the Interactive scenario, which carries the tightest DeepSeek-R1 latency bounds (1,500 ms and 15 ms in the rules) and is one of the scenarios where the rules permit speculative decoding; a team running a Server-style service should plan on the lower figure.
Scaling claims also survive. NVIDIA’s 99% scaling across four GB300 NVL72 racks recomputes to 99.5%: 9,393 per accelerator at 288 accelerators (entry 6.1-0073) against 9,441 at 72 (entry 6.1-0074), DeepSeek-R1 Offline. AMD’s 95% scalability from 8 to 72 MI355X recomputes to 94.6% in Server and 94.9% in Offline (entries 6.1-0003 and 6.1-0004). Both are real, and both describe only the configurations submitted, not scaling beyond them.
Crusoe’s headline of more than 5.5 million tokens per second on gpt-oss-120b and 2.9 million on DeepSeek-R1, both on 512 MI355X accelerators, holds for Offline: 5,749,440 and 2,901,950 tokens per second (entries 6.1-0027 and 6.1-0026). In Server, the same systems posted 5,392,930 and 2,405,310, below both thresholds. For capacity planning against a latency target, the Server totals apply, and the gap between the two scenarios is 6.6% on gpt-oss-120b.
| Reported by | Claim | GPU Insights recomputation | Verdict |
|---|---|---|---|
| NVIDIA | Vera Rubin NVL72 delivers up to 2.5× on DeepSeek-R1 versus prior generation | Per accelerator vs GB300 NVL72, 72 GPUs each: Server 1.97×, Offline 1.74×, Interactive 2.57× | Holds for Interactive only; Preview category |
| NVIDIA | 99% scaling efficiency across four GB300 NVL72 racks | DeepSeek-R1 Offline, 288 vs 72 accelerators: 99.5% | Holds |
| AMD | 95% scalability from 8 to 72 MI355X on gpt-oss-120b | Server 94.6%, Offline 94.9% | Holds (rounds to 95%) |
| CoreWeave | GB300 NVL72: 1.16 million tokens/s aggregate; per-GPU +17% Offline and +8% Server since v6.0 | Server total 1,160,490; per-GPU +16.9% Offline, +7.8% Server | Holds; GPU count changed 64 to 72 |
| Crusoe | Over 5.5 million tokens/s on gpt-oss-120b; 2.9 million on DeepSeek-R1 (512 MI355X) | Offline 5,749,440 and 2,901,950; Server 5,392,930 and 2,405,310 | Holds for Offline only |
| Lambda | +8.85% Server and +8.79% Offline on identical hardware since v6.0 (4x GB300) | +8.85% Server, +8.79% Offline | Arithmetic holds; hardware identity per submitter |
Reported by: each submitter in MLCommons’ supplemental document (September 2026), which MLCommons states does not reflect its views; recomputation by GPU Insights from official v6.0 and v6.1 entries retrieved October 2, 2026.[1][2] Takeaway: every claim is arithmetically correct, and four of six depend on scenario, category, or configuration choices.
From tokens per second to a break-even price: the rule and a worked example for B200 versus B300
Per-GPU throughput converts to cost with one formula. Cost per million output tokens equals the GPU-hour price times 1,000,000, divided by tokens per second per GPU times 3,600 times utilization. Two GPUs cost the same per token when the ratio of their hourly prices equals the ratio of their throughputs, which makes the throughput ratio a break-even price ratio: the highest premium worth paying for the faster part on that workload.
On gpt-oss-120b Server, with 8-GPU Available rows as the basis and the B200 row as the baseline, the break-even ratios are 1.260 for B300, 1.255 for MI355X, 1.421 for GB300, and 0.971 for MI350X. A B300 quote more than 26.0% above a B200 quote on the same terms costs more per token on this workload; a GB300 quote is competitive up to 42.1% above; an MI350X quote must come in 2.9% below B200 to break even.
The rule assumes your model, precision, context lengths, and latency targets resemble the benchmark’s, and that you can run the submitted stack. The AMD row above used a PyTorch-based stack, while HPE’s vLLM 0.22.0 row on the same silicon posted 13,604 per GPU, 3.9% lower (entries 6.1-0050 and 6.1-0003). If you deploy on vLLM, the break-even ratio for MI355X versus B300 moves accordingly.
Worked example. Assume a B200 at $5.00 per GPU-hour and 50% utilization. At 11,276 tokens per second per GPU the cost is $0.246 per million tokens. A B300 priced at $5.00 costs $0.195 per million tokens, 20.7% less. The same B300 at $6.30 (the break-even price, 26.0% above B200) costs $0.246, the same as the B200 to three decimals. That price is the contract ceiling for the upgrade at this utilization; utilization changes both costs by the same factor, so the break-even price does not move with it.
| Price per GPU-hour | 30% utilization | 50% utilization | 70% utilization | 100% utilization |
|---|---|---|---|---|
| $3.00 | $0.195 | $0.117 | $0.084 | $0.059 |
| $5.00 | $0.326 | $0.195 | $0.140 | $0.098 |
| $7.00 | $0.456 | $0.274 | $0.195 | $0.137 |
Source: GPU Insights editorial estimate using the formula above and the official 6.1-0052 gpt-oss-120b Server result;[1] prices are illustrative, not quotes. Takeaway: a 40% price increase ($5 to $7) at fixed utilization raises cost per token by exactly 40%, while moving utilization from 50% to 30% raises it by 67%.
The strongest objection: a tuned lab harness cannot rank production hardware
The best objection to everything above is that MLPerf® Inference v6.1 rows are tuned by the vendors who submit them, run on fixed datasets, and forbid the cross-request caching that production systems depend on. A per-GPU ranking, on this view, measures submitter engineering effort rather than hardware. The evidence in this article partly supports the objection: the AMD gain of 37.9% came from software on fixed silicon, and the spread between submitters on the same B300 is 13.5%.
The response is that the objection argues against ranking, not against using the data. Absolute levels do not transfer to production, and ordering inside a 4% band is noise. But the cross-round, same-harness ratios in this article transfer better than the levels do, because they cancel the harness. A 26.0% throughput gap between B300 and B200 on identical rules is a prior about hardware; a 37.9% software gain is a prior about how much of any headline is still available to you through an upgrade of the stack you control. Over half of the submitters in this round also used the new API-centric harness that MLCommons says reflects real deployments more closely, according to the release, which narrows the gap the objection depends on.
What this analysis can’t tell you
The primary limitation is that per-GPU values compare rows that differ in GPU count, software stack, host CPU, and submitter, and we cannot hold those fixed. The per-GPU number for a 72-GPU rack includes interconnect effects that an 8-GPU row lacks, and the best row for a family is a maximum, which overstates the typical result; the medians in Table 1 show the gap. AMD’s own rows show a 72-GPU system at 94.6% of the per-GPU rate of its 8-GPU row, so scale alone can move the figure by roughly 5%.
Two limitations affect the software-versus-silicon argument specifically. First, the public compatibility table retrieved on October 2, 2026 ends at v6.0 and lists no v6.1 column, so we rely on MLCommons’ own cross-round comparisons and on submitters’ v6.0-to-v6.1 statements to treat the gpt-oss-120b results as comparable. Second, chassis and host identity across rounds rest on submitter labels, which differ between the v6.0 and v6.1 rows even where the platform label matches.
Lower in the hierarchy: the sheet’s tokens-per-second unit is not defined in the file, and our dollar figures assume generated tokens; billing based on prompt tokens changes the result. The results contain no price data, so every cost figure uses an illustrative price. Power is excluded: the Messaging Guidelines allow only measured system power for power-normalized comparisons, and this analysis uses no power data. Finally, the H200 gap, one v6.0 row on a different stack, means this article cannot answer how much a Hopper fleet gains from a move to Blackwell.
Decision framework by role: thresholds that change a purchase or a migration
- Infrastructure architect. Ask every vendor to state the quote as a ratio to a B200 hourly price on identical contract terms. Accept up to 26.0% for B300, up to 42.1% for GB300, and up to 25.5% for MI355X, and only if your serving stack reproduces the stack of the cited entry. Above those ratios the faster part costs more per token on gpt-oss-120b Server.
- ML Ops or inference lead. Pin the exact serving-stack version in every benchmark you run and re-run after each ROCm or TensorRT-LLM release. Observed software-only moves in this round span 8.9% to 37.9% per GPU in Server over six months; schedule a re-benchmark for every stack release rather than carrying last quarter’s throughput into this quarter’s capacity plan.
- ML engineer. If your workload is not a mixture-of-experts reasoning model with long outputs, or depends on prefix reuse, treat the per-GPU values as an upper bound and replay your own request trace before sizing. These results forbid cross-request caching, so a prefix-heavy service can differ materially in either direction.
- Procurement and finance. Write a re-pricing or re-benchmark clause keyed to the next published round, and require the entry ID behind any throughput claim in a quote. Discard any quote that cites aggregate system throughput without a GPU count; the Crusoe 512-GPU example shows per-GPU rates 24% below a small system on comparable vLLM releases.
If you must buy before Rubin ships: the conditional recommendation and the next milestone
If delivery is needed this quarter, the data support buying on B300-class or MI355X-class capacity at a price ratio no higher than the break-even values above, and writing the software version into the contract. The two parts are 0.4% apart on gpt-oss-120b Server, so the tiebreakers are the stack you can operate and the quoted hourly price, not the benchmark. If delivery can wait for Rubin-class general availability, the Preview rows set an upper envelope of 5.65× on DeepSeek-R1 Server that Available hardware does not yet deliver.
The thesis stands with one refinement. Software maturity, not the vendor name, moved the numbers most in this round: 37.9% for AMD in six months against a 26.0% hardware step from B200 to B300. The next milestone is structural: MLCommons says MLPerf® Endpoints will replace Inference in its datacenter benchmark family and the release gives no date, so the number of remaining rounds under this harness is unknown. Re-baseline the break-even ratios when the first Endpoints results appear.
FAQ: edge cases when reading per-GPU benchmark data
Can I compare Server and Offline per-GPU numbers directly?
No. Offline reports throughput with no latency bound, and Server enforces time-to-first-token and time-per-output-token limits. In the same entries, Offline exceeds Server by 7.6% on the 8-GPU MI355X row (entry 6.1-0003) and by 19.8% on the 4-GPU GB200 row (entry 6.1-0094), so mixing them biases a comparison by a different amount for each part.
How much of the headline should I expect if I run vLLM instead of the submitter’s own stack?
On MI355X in this round, AMD’s own PyTorch-based 8-GPU row leads the vLLM 0.22.0 rows by 2.8% (Dell, entry 6.1-0037) and 4.0% (HPE, entry 6.1-0050) in Server, and by 3.4% against Dell in Offline. The vLLM rows cluster within about 1.2% of each other, so plan on the lower cluster if vLLM is your production engine.
Does a Preview result belong in a purchase decision?
Use it as an upper envelope, not a forecast. MLCommons describes the Vera Rubin platforms as soon-to-be-released, and the Preview rows are what lift the DeepSeek-R1 Server gain from 3.04× to 5.65×. Revisit the decision when the same platform appears under Available in a later round.
Is a 1-GPU row’s per-GPU number comparable to a 72-GPU row’s?
Only with a stated scale penalty. The best B300 Llama2-70b-99.9 Server row is a single-GPU entry (6.1-0103), and AMD’s 72-GPU MI355X row reaches 94.6% of its 8-GPU per-GPU rate. Comparisons across GPU counts must disclose the counts, as the MLCommons Messaging Guidelines require.
Are the per-GPU figures and ratios in this article official benchmark results?
No. The underlying entries are official and published by MLCommons; the division by Total Accelerators, the ratios, and the break-even prices are our derived metrics. They are not official or verified benchmark scores and carry the unverified label in the footnotes.
Related reading
- H200 vs B200 vs H100 cost per token — rental-price view of the same break-even logic used above, for teams pricing Hopper against Blackwell.
- vLLM vs SGLang vs TensorRT-LLM — the serving-stack choice that explains much of the same-silicon spread measured here.
- NVIDIA Rubin vs AMD Helios — the rack-scale generation behind the Preview rows discussed in this article.
- Enterprise GPU procurement playbook — contract terms for the re-pricing and re-benchmark clauses recommended above.
- GPU cluster TCO: on-premise vs cloud — converts a per-GPU throughput figure into total cost of ownership at fleet scale.
MLPerf® result footnotes and entry IDs
- MLPerf® Inference v6.1 Closed Datacenter; gpt-oss-120b (Server, Offline), Llama2-70b-99.9 (Server), DeepSeek-R1 (Server, Offline, Interactive). Retrieved from https://mlcommons.org/benchmarks/inference-datacenter/ (official results repository, summary.xlsx) on 2 October 2026; entries 6.1-0003, 6.1-0004, 6.1-0009, 6.1-0013, 6.1-0016, 6.1-0021, 6.1-0023, 6.1-0025, 6.1-0026, 6.1-0027, 6.1-0037, 6.1-0046, 6.1-0050, 6.1-0052, 6.1-0065, 6.1-0068, 6.1-0069, 6.1-0073, 6.1-0074, 6.1-0075, 6.1-0082, 6.1-0088, 6.1-0091, 6.1-0094, 6.1-0103, 6.1-0106, 6.1-0107. Per-GPU values, ratios, scaling percentages, and break-even prices are derived metrics computed by GPU Insights and are not official MLPerf® metrics. Result not verified by MLCommons Association. The MLPerf name and logo are registered and unregistered trademarks of MLCommons Association in the United States and other countries. All rights reserved. Unauthorized use strictly prohibited. See www.mlcommons.org for more information.
- MLPerf® Inference v6.0 Closed Datacenter; gpt-oss-120b (Server, Offline). Retrieved from https://github.com/mlcommons/inference_results_v6.0 (summary_results.json) on 2 October 2026; entries 6.0-0002, 6.0-0016, 6.0-0063, 6.0-0092. Derived metrics are not official MLPerf® metrics. Result not verified by MLCommons Association. The MLPerf name and logo are registered and unregistered trademarks of MLCommons Association in the United States and other countries. All rights reserved. Unauthorized use strictly prohibited. See www.mlcommons.org for more information.
- MLPerf® Inference v5.1 Closed Datacenter; DeepSeek-R1 (Server, Offline). Retrieved from https://github.com/mlcommons/inference_results_v5.1 (summary_results.json) on 2 October 2026; entries 5.1-0072, 5.1-0097. Derived metrics are not official MLPerf® metrics. Result not verified by MLCommons Association. The MLPerf name and logo are registered and unregistered trademarks of MLCommons Association in the United States and other countries. All rights reserved. Unauthorized use strictly prohibited. See www.mlcommons.org for more information.
Comparisons in this article identify version, division (Closed), category (Available or Preview), scenario, and GPU count in the table or text, following the MLPerf® Results Messaging Guidelines. Results were retrieved after the two-week window those guidelines set for non-submitters following the September 16, 2026 publication.
Sources & further reading
- MLCommons — MLPerf® Inference v6.1 results press release (September 16, 2026)
- MLCommons — MLPerf® Inference v6.1 working-group chairs overview (September 2026)
- MLCommons — Inference: Datacenter results page (retrieved October 2, 2026)
- MLCommons — Supplemental submitter statements for MLPerf® Inference v6.1 (PDF, September 2026)
- MLCommons — official MLPerf® Inference v6.1 results repository (summary.xlsx)
- MLCommons — official MLPerf® Inference v6.0 results repository
- MLCommons — official MLPerf® Inference v5.1 results repository
- MLCommons — MLPerf® Inference rules (inference_rules.adoc, retrieved October 2, 2026)
- MLCommons — MLPerf® Results Messaging Guidelines
- MLCommons — MLPerf® Compatibility Table (retrieved October 2, 2026)
- Lambda — MLPerf® Inference v6.1 analyst blog post (September 16, 2026)
For the customer mix in the quarter these benchmark systems were submitted, see NVIDIA data center revenue in Q2 FY2027.

Author: Iovanny Olguín Ávila
Computer Systems Engineer with an MSc in Computer Science. I apply quantitative analysis and data-driven methodologies to evaluate financial instruments, investment vehicles, and emerging technologies. My technical background allows me to cut through marketing language and analyze the actual mechanics of financial products — from HELOC structures to Medicare Advantage plan design to business credit card reward algorithms.