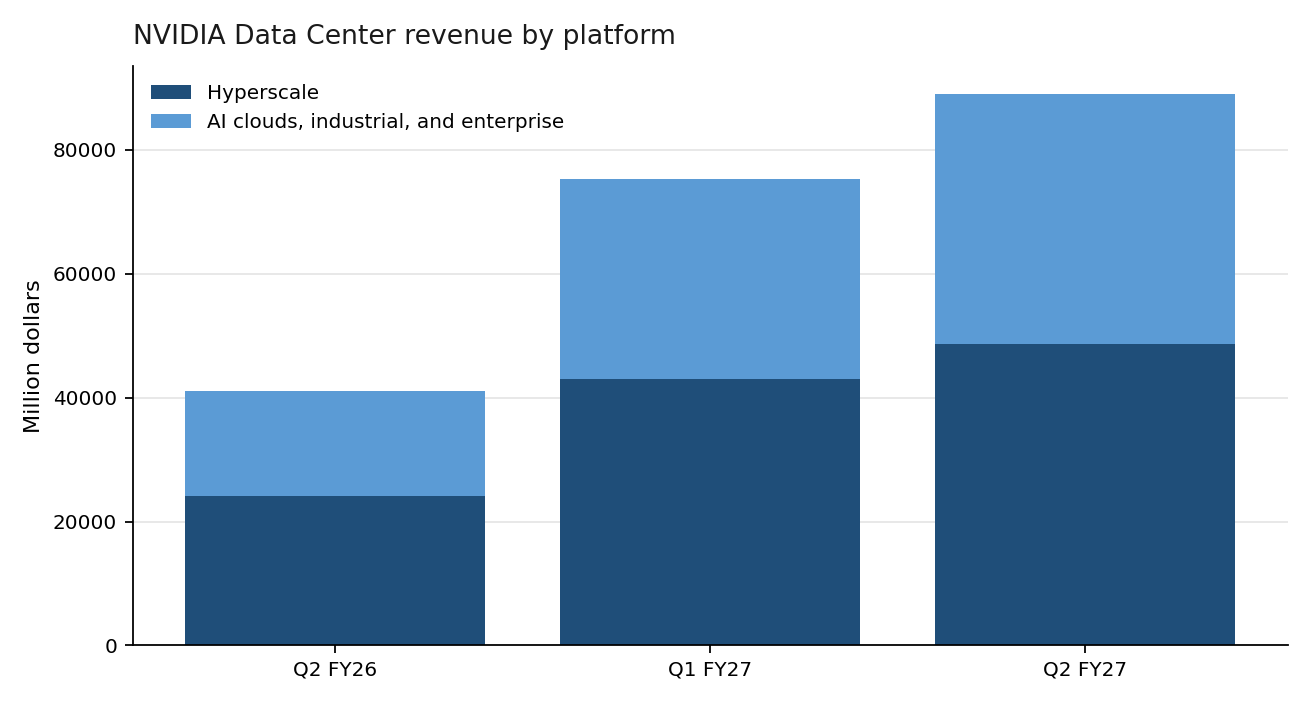
A capacity plan that still treats NVIDIA’s growth as a single Data Center number will miss where the incremental GPUs went in the July quarter. NVIDIA data center revenue was $89,023 million in the second quarter of fiscal 2027, which ended July 26, 2026. Inside that total, Hyperscale was $48,710 million and AI Clouds, Industrial, and Enterprise (ACIE) was $40,313 million. The two lines add to the Data Center total with nothing left over. ACIE grew 25.21 percent from the prior quarter. Hyperscale grew 13.15 percent.
Thesis: for a buyer placing orders in the quarter after this print, the relevant fact is the mix, not the 117 percent year-on-year headline. Hyperscale is still the larger line, at 54.72 percent of Data Center revenue, but ACIE added the faster sequential growth, and NVIDIA’s outlook for the next quarter assumes no Data Center compute revenue from China. A negotiation that ignores those two sentences is aimed at last year’s customer.
The percentages in this article are recomputed from the dollar figures in NVIDIA’s CFO commentary filed with the Securities and Exchange Commission, exhibit 99.1 to the Form 8-K for the quarter. Where NVIDIA prints a rounded percent, both numbers are shown. Forward-looking sentences in that commentary are NVIDIA’s statements, not ours. NVIDIA data center revenue is the line this page will not blend back into a company total until the split is on the table.
NVIDIA data center revenue, split the way the commentary splits it
NVIDIA’s CFO commentary for the quarter ended July 26, 2026 reports company revenue of $96,221 million, up from $81,615 million in the prior quarter and $46,743 million in the year-ago quarter. Data Center revenue is $89,023 million, against $75,246 million and $41,096 million in those earlier periods. Edge Computing, which NVIDIA does not include in Data Center, is $7,198 million. Data Center plus Edge equals total revenue: 89,023 + 7,198 = 96,221. The same total splits the other way into Compute & Networking of $88,299 million and Graphics of $7,922 million.
Inside Data Center, Hyperscale plus ACIE equals Data Center: 48,710 + 40,313 = 89,023. There is no third Data Center bucket in the table. During the quarter NVIDIA reclassified one company from ACIE to Hyperscale because that customer’s business model changed, and it recast the prior periods for that company. The growth rates below use the recast figures NVIDIA printed. They are not a comparison against the old, unrecast classification.
NVIDIA says Data Center revenue was up 18 percent sequentially and 117 percent from a year ago, on the ramp of Blackwell Ultra. The unrounded ratios are 89,023 / 75,246 − 1 = 18.31 percent sequential, and 89,023 / 41,096 − 1 = 116.62 percent year on year, which rounds to the 117 percent NVIDIA states. Company revenue was up 17.90 percent sequentially and 105.85 percent year on year, against NVIDIA’s rounded 18 percent and 106 percent. Rounding is not the story. The gap between the two Data Center lines is.
| Line | Q2 FY26 | Q1 FY27 | Q2 FY27 | Sequential, unrounded | Year on year, unrounded |
|---|---|---|---|---|---|
| Hyperscale | 24,168 | 43,050 | 48,710 | 13.15% | 101.55% |
| AI clouds, industrial, and enterprise | 16,928 | 32,196 | 40,313 | 25.21% | 138.14% |
| Data Center | 41,096 | 75,246 | 89,023 | 18.31% | 116.62% |
| Edge Computing | 5,647 | 6,369 | 7,198 | 13.02% | 27.47% |
| Total | 46,743 | 81,615 | 96,221 | 17.90% | 105.85% |
Source: NVIDIA CFO commentary, exhibit to the Form 8-K for the quarter ended July 26, 2026, retrieved October 2, 2026. Sequential and year-on-year rates computed by GPU Insights from the dollar columns. Takeaway: ACIE’s sequential growth, 25.21 percent, exceeds Hyperscale’s 13.15 percent by 12.06 percentage points.
Edge sequential growth in the table is 7,198 / 6,369 − 1 = 13.02 percent, and year-on-year growth is 7,198 / 5,647 − 1 = 27.47 percent. NVIDIA rounds those to 13 percent and 27 percent. The commentary attributes the Edge increase to Blackwell workstations, partly offset by slower consumer PC sales and higher memory and systems prices. Edge is not a GPU-cloud demand series.
Where a buyer sits inside the 54.72 percent
Hyperscale’s $48,710 million is 54.72 percent of Data Center revenue. ACIE’s $40,313 million is 45.28 percent. A year earlier the same lines were 24,168 / 41,096 = 58.81 percent Hyperscale and 41.19 percent ACIE. The mix shifted about 4.09 percentage points toward ACIE. Read against total company revenue, NVIDIA data center revenue is 89,023 / 96,221 = 92.52 percent of the quarter. NVIDIA’s own words for the ACIE increase are end demand from AI natives, enterprises, and sovereign customers, plus hyperscalers that buy through AI clouds.
That classification is not a forecast of street price. It says which customer bucket NVIDIA says grew faster after a one-company reclass and a prior-period recast. A team buying through CoreWeave, Lambda, or a similar provider should read itself into ACIE only if NVIDIA would. The commentary does not list vendors under the line. The product comparison across chip suppliers is a different page: the NVIDIA and AMD data-center chip analysis does not use this quarterly split, and this page does not re-rank chips.
China is a separate constraint on the next number, not a footnote. NVIDIA says shipments of Data Center Hopper products to China during the quarter were less than 1 percent of Data Center revenue. The outlook states that NVIDIA is not assuming any Data Center compute revenue from China. A plan that adds a China deployment on top of NVIDIA’s shipment commentary is adding a market NVIDIA has removed from its own forward number. Export-control mechanics belong in the sovereign-AI and export-controls guide, not in a restatement here.
What the next-quarter outlook does and does not promise
NVIDIA’s outlook for the third quarter of fiscal 2027 is revenue of $108.0 billion, plus or minus 2 percent. In the commentary’s million-dollar units that midpoint is 108,000. Against Q2 revenue of 96,221, the midpoint is a 12.24 percent sequential increase. The low end, 105,840, is a 9.997 percent increase. The high end, 110,160, is a 14.49 percent increase. The outlook is for company revenue, not for Data Center revenue, and it excludes Data Center compute revenue from China by NVIDIA’s statement.
Gross margin is guided to 74.0 percent, plus or minus 50 basis points, against a reported GAAP and non-GAAP gross margin of 75.0 percent in the second quarter. NVIDIA says the year-on-year margin increase came from mix, on Blackwell Ultra, and that margins were about flat sequentially because Blackwell remains the vast majority of revenue. “Vast majority” is NVIDIA’s phrase. The commentary does not give Blackwell’s share as a percent.
GAAP diluted earnings per share were $2.46 and non-GAAP were $2.22. GAAP net income rose 2.34 percent sequentially, to $59,688 million from $58,321 million. Non-GAAP net income rose 18.45 percent, to $53,954 million from $45,548 million. NVIDIA reports $7.8 billion of net gains from equity securities in the quarter, which non-GAAP results exclude. The GAAP earnings-per-share print is the wrong series for judging GPU demand. Operating income, up 19 percent in NVIDIA’s rounded disclosure, to $63,734 million GAAP from $53,536 million, tracks the business more closely than net income does.
Supply commitments, inventory, and a guarantee that is not a purchase order
NVIDIA says purchase commitments rose from $119 billion in the prior quarter to $279 billion, primarily for memory. The increase is 279 / 119 − 1 = 134.45 percent. Of the $279 billion supply-and-capacity line, $92 billion falls in the remainder of fiscal 2027, which is 32.97 percent of that line. The commentary presents this as supply secured against demand over several years. It is a commitment table, not a delivery schedule by GPU model.
Inventory was $31.6 billion, up from $25.8 billion sequentially, a 22.48 percent increase, which NVIDIA ties to preparation for Vera Rubin in the third quarter. Accounts receivable were $63.1 billion and days sales outstanding moved from 45 to 60, which NVIDIA attributes to extended payment terms on large, multi-quarter agreements with certain investment-grade customers. Longer terms are a financing fact for those customers. They are not a discount available to every buyer. How to read a capacity contract is the subject of the procurement playbook.
Two guarantee figures should not be added into a demand model without the conditions. NVIDIA discloses a maximum gross exposure of $3.5 billion on land, power, and shell guarantees for certain AI-cloud partners, and, separately, guarantees signed in August 2026 and capped at $105 billion related to about 4.25 GW at SB Energy’s PORTS-Pike campus in Ohio, described as hosting NVIDIA infrastructure under 20-year leases to OpenAI, subject to limited exceptions. The caps sum to $108.5 billion. NVIDIA says the $105 billion cap becomes effective in phases, with the first data centers expected ready in fiscal 2029, and that exposure declines as lease payments are made. NVIDIA also states that each generation of infrastructure at the site could represent about 1.5 million NVIDIA GPUs, or about $150 billion to $200 billion of NVIDIA revenue. Those GPU and revenue figures are NVIDIA’s expectation, printed inside a forward-looking section, and they are not a booked order in the Q2 revenue table. The rack that would fill a later generation is discussed in the Rubin and Helios comparison.
Worked example. A buyer is offered capacity in the quarter NVIDIA has guided. The midpoint outlook is 12.24 percent more company revenue than Q2, not 117 percent. If the buyer’s provider sits in the ACIE description NVIDIA uses, the latest sequential growth of that line was 25.21 percent, against 13.15 percent for Hyperscale, on recast numbers. Neither rate is a promise that this buyer’s cluster will be available. The China exclusion means a follow-on quote that depends on Hopper supply into China is outside the outlook NVIDIA published. The worked comparison is 40,313 / 32,196 − 1 against 48,710 / 43,050 − 1.
The counterargument: the whole print is hyperscale, and the split is marketing
Hyperscale is still 54.72 percent of Data Center revenue, and NVIDIA says hyperscalers also show up inside ACIE when they use AI clouds. Adding those unlabeled hyperscale dollars back would make the “enterprise” line look less like a new buyer and more like the same buyer with a different contract path. The one-company reclass in the quarter shows that NVIDIA itself moves accounts between the lines when the business model changes.
That objection limits how hard the mix shift can be pushed. It does not restore a single growth rate. Even after the recast, the printed ACIE line grew 12.06 percentage points faster, sequentially, than the printed Hyperscale line. A buyer who can choose a direct hyperscale path or a neocloud path is choosing between two lines NVIDIA already reports separately. The unknown is the unlabeled overlap, and the honest use of the table is to ask the provider which line NVIDIA would put the order in, not to pretend the overlap is zero.
What this analysis can’t tell you
It cannot tell you Blackwell’s unit share, ASP, or lead time. It cannot tell you whether a named cloud provider is inside Hyperscale or ACIE. It cannot tell you that the $105 billion guarantee will be drawn, or that 1.5 million GPUs will ship to one campus. Those are NVIDIA’s forward-looking statements, with the conditions above. It cannot tell you AMD’s quarter. GAAP earnings per share are distorted by the $7.8 billion equity-securities gain. Days sales outstanding of 60 describes NVIDIA’s receivables, not the payment terms a smaller buyer will be offered.
The commentary is the quarter ended July 26, 2026, read on October 2, 2026. A later 10-Q or a pre-announcement supersedes it. Prior-period platform dollars are the recast series.
What to do with the split before the next order
If the deployment is outside China and the provider matches NVIDIA’s ACIE description, treat 25.21 percent as the latest sequential growth of that reported line, and treat availability as still tight enough that NVIDIA increased supply commitments by 134.45 percent in one quarter, mostly for memory. If the deployment is a direct hyperscale contract, the relevant sequential rate is 13.15 percent, on a line that is still the majority of Data Center revenue. If the deployment depends on Data Center compute shipped to China, it sits outside both the quarter’s Hopper note and the outlook.
A FinOps lead should not annualize the 117 percent year-on-year rate into a 2027 price forecast. The sequential company outlook is about 12 percent at the midpoint. A platform lead timing a Vera Rubin pilot should read the inventory increase of 22.48 percent as NVIDIA’s preparation statement, and should read the MLPerf v6.1 per-GPU results before treating a Preview-category rack as deliverable. A procurement lead should separate three documents: the revenue table, the commitment table, and the guarantee table. Only the first is recognized revenue.
FAQ
What was NVIDIA data center revenue in Q2 fiscal 2027?
NVIDIA reported Data Center revenue of $89,023 million for the quarter ended July 26, 2026. Hyperscale was $48,710 million and AI Clouds, Industrial, and Enterprise was $40,313 million. Those two lines sum to the Data Center total.
Did hyperscale or everyone else grow faster?
On the recast figures, ACIE grew 25.21 percent sequentially and Hyperscale grew 13.15 percent. Hyperscale remains larger, at 54.72 percent of Data Center revenue. NVIDIA recast prior periods because one customer moved from ACIE to Hyperscale.
Does the outlook include China?
NVIDIA says the third-quarter revenue outlook of $108.0 billion, plus or minus 2 percent, assumes no Data Center compute revenue from China. Hopper shipments to China in the second quarter were less than 1 percent of Data Center revenue, according to the same commentary.
Why did GAAP and non-GAAP earnings diverge?
GAAP diluted earnings per share were $2.46 and non-GAAP were $2.22. NVIDIA reports $7.8 billion of equity-securities gains in the quarter, which the non-GAAP figures exclude. Non-GAAP net income rose 18.45 percent sequentially. GAAP net income rose 2.34 percent.
Is the $105 billion figure an order for GPUs?
It is the cap NVIDIA states on guarantees for land, power, and shell at a campus leased to OpenAI, becoming effective in phases, with the first readiness expected in fiscal 2029. NVIDIA separately says a generation of its infrastructure there could mean about 1.5 million GPUs. That sentence is a company expectation, not Q2 revenue.
Sources & further reading
- NVIDIA Corporation, CFO commentary on second-quarter fiscal 2027 results, quarter ended July 26, 2026
- NVIDIA Corporation, press release on second-quarter fiscal 2027 results, August 26, 2026
Related reading
- NVIDIA and AMD AI chips: the product comparison
- NVIDIA Rubin versus AMD Helios
- Sovereign AI and US export controls
- Enterprise GPU procurement playbook
- MLPerf Inference v6.1 per GPU
Updated: October 2026. Figures are taken from NVIDIA’s SEC exhibits for the quarter ended July 26, 2026 and recomputed where noted. Forward-looking amounts are NVIDIA’s, not forecasts by this site. This page is not investment advice.

Author: Iovanny Olguín Ávila
Computer Systems Engineer with an MSc in Computer Science. I apply quantitative analysis and data-driven methodologies to evaluate financial instruments, investment vehicles, and emerging technologies. My technical background allows me to cut through marketing language and analyze the actual mechanics of financial products — from HELOC structures to Medicare Advantage plan design to business credit card reward algorithms.