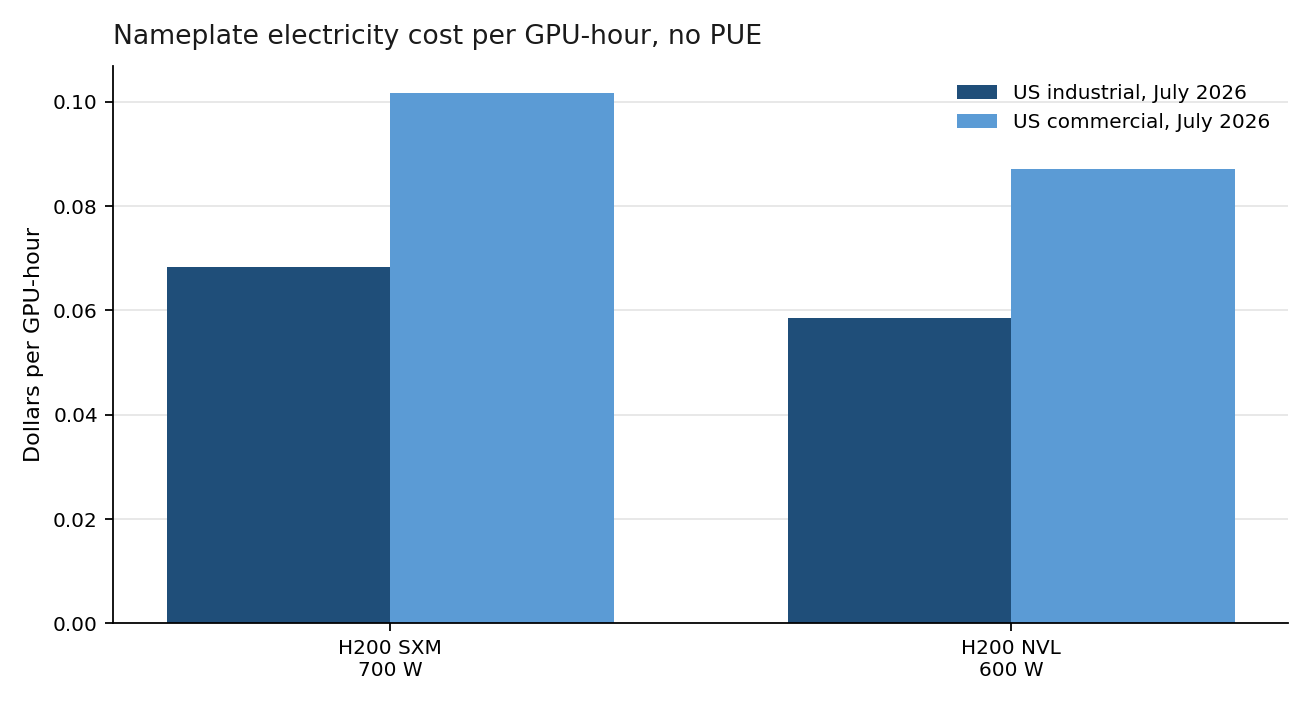
A GPU-hour quote that never shows the power line can hide a cost that is small next to rent and large enough to reject a too-cheap bid. GPU electricity cost at the H200 SXM’s published ceiling of 700 watts, run for a full hour, is 0.7 kilowatt-hours. At the U.S. average industrial price for July 2026, 9.77 cents per kilowatt-hour, that hour costs $0.0684. At the commercial average, 14.53 cents, it costs $0.1017. Those are nameplate figures, before facility overhead.
Thesis: U.S. average retail electricity, priced by the Energy Information Administration for July 2026, puts a floor under a 700-watt GPU of about seven to ten cents an hour depending on whether the meter is industrial or commercial. It does not decide a cloud bill. It does decide when a quote cannot be paying the U.S. average and still covering the watts on the nameplate. Anything in the quote above that floor is not electricity at these averages.
The prices are preliminary EIA estimates. The watts are NVIDIA’s stated maxima for two H200 board designs, which NVIDIA marks as preliminary, plus the 700-watt H100 configuration Meta describes for Llama 3 405B training. No GPU was metered for this article. GPU electricity cost below is the product of those ceilings and those averages, nothing else.
GPU electricity cost starts from the July 2026 prices
Table 5.3 of the EIA Electric Power Monthly reports the average price of electricity to ultimate customers, in cents per kilowatt-hour. For July 2026 the United States figures are 18.31 cents residential, 14.53 cents commercial, 9.77 cents industrial, 14.97 cents transportation, and 14.99 cents for all sectors. The year-to-date industrial average for 2026 is 9.03 cents. June 2026 industrial was 9.17 cents. July is 6.54 percent above June (9.77 / 9.17 − 1).
The EIA states that 2025 and 2026 values are preliminary estimates from a cutoff sample, and that values for 2024 and earlier years are final. It also states that utilities may classify commercial and industrial customers by industry code or by rate-schedule demand, and that a data month’s sales do not match generation one-for-one. The average is revenue divided by kilowatt-hours sold. It folds energy, delivery, and fixed charges into one number. It is not the tariff rider on a particular interconnection.
A data center can land on a commercial schedule, an industrial schedule, or a contract the average does not show. Using the industrial series as “the data center price” is an assumption, and this article does not make it. Both series are carried through every product. The commercial price is 14.53 / 9.77 − 1 = 48.72 percent above the industrial price, so the choice of series moves the GPU-hour cost by that fraction and nothing else, as long as watts are held constant. Where the power comes from, and how long the interconnection takes, is the subject of the data-center power analysis. This page starts after the meter exists.
Nameplate watts, not a measured rack
NVIDIA’s H200 specification table lists a maximum thermal design power of up to 700 watts, configurable, for the H200 SXM, and up to 600 watts, configurable, for the H200 NVL. The same table lists 141 GB of memory and 4.8 TB/s of bandwidth for both. Footnote 1 says the specifications are preliminary and may change. “Up to” means the table is a ceiling the board can be configured under, not a measurement of average draw on a training job.
The Llama 3 paper states that Llama 3 405B was trained on up to 16,000 H100 GPUs, each running at 700 watts TDP with 80 GB of HBM3. That sentence describes the GPUs in that training run. It is not a claim that every H100 sold is a 700-watt, 80 GB part. It is used here as a second 700-watt reference from a primary paper, so the H200 SXM arithmetic can be compared with a documented H100 configuration at the same ceiling.
Energy at the ceiling is linear. A card configured to 700 watts and drawing that power for one hour uses 0.7 kWh. At 350 watts average it uses 0.35 kWh and the bill halves. Idle time, power capping, and a job that never reaches the thermal limit all cut the cost. They do not raise it above the ceiling. A quote for “power included” that is silent on the cap is still bounded by this product: the provider cannot have spent more on GPU electricity, at a given price per kilowatt-hour, than watts-drawn times hours times that price.
| Board | Ceiling used | kWh per hour at the ceiling | Industrial, 9.77¢/kWh | Commercial, 14.53¢/kWh |
|---|---|---|---|---|
| H200 SXM | 700 W | 0.70 | $0.0684 | $0.1017 |
| H200 NVL | 600 W | 0.60 | $0.0586 | $0.0872 |
| H100, as described for Llama 3 405B training | 700 W | 0.70 | $0.0684 | $0.1017 |
Source: watts from the NVIDIA H200 product page and from arXiv:2407.21783; prices from EIA Electric Power Monthly Table 5.3, July 2026, retrieved October 2, 2026. Dollar figures computed by GPU Insights as (cents/100) × (watts/1000). Takeaway: at the ceiling, commercial power costs $0.1017 per hour on a 700-watt GPU and $0.0872 on a 600-watt GPU.
A year at the ceiling, and the overhead this page will not invent
There are 8,760 hours in a 365-day year. A 700-watt H200 SXM drawing its ceiling for every one of them uses 6,132 kWh. At 9.77 cents that is $599.10. At 14.53 cents it is $890.98. The 600-watt NVL ceiling is $513.51 industrial and $763.70 commercial. Residential 18.31 cents is the wrong series for a data center; at 700 watts it would be $1,122.77 a year, and it is shown only so a home comparison is not silently mixed into the industrial number. The local hardware guide is the right page for a single workstation on a residential meter.
Facility overhead is the number people multiply in next, and this article does not have a measured one. Power usage effectiveness is site energy divided by IT energy. A multiplier of 1.2 applied to the $0.0684 industrial hour gives $0.0821. A multiplier of 1.5 gives $0.1026. Those two multipliers are assumptions for a sensitivity, not EIA statistics and not a reading of any campuse’s bill. Real overhead depends on cooling design, climate, and how much of the building is the GPU. Treating 1.2 as “the” AI-data-center PUE would over-claim.
The annual figures assume the ceiling for all 8,760 hours, which a real accelerator does not do. They are an upper bound on the GPU’s own electricity at the July average price, not an operating budget. Utilization of the silicon and utilization of the watts are different. A card that is powered and idle still draws power. This table does not include that idle draw, because neither source states it.
| Board and ceiling | Industrial | Commercial | Industrial × 1.2 | Industrial × 1.5 |
|---|---|---|---|---|
| 700 W | $599.10 | $890.98 | $718.92 | $898.65 |
| 600 W | $513.51 | $763.70 | $616.21 | $770.27 |
Source: EIA Table 5.3 July 2026 prices and the watt ceilings above. The 1.2 and 1.5 columns are GPU Insights sensitivities, not measured power-usage effectiveness. Takeaway: a full year at the 700-watt ceiling is $599.10 at the industrial average, before the building.
Worked example. A 700-watt H200 SXM runs at its ceiling for 12 hours and at half the ceiling for 12 hours, on the industrial average. Energy is 0.7 × 12 + 0.35 × 12 = 12.6 kWh. Cost is 12.6 × $0.0977 = $1.231. The same day on the commercial average is 12.6 × $0.1453 = $1.831. A GPU-hour rental that is priced near $2, for the hours the card is actually reserved, is an order of magnitude above this energy. The rental can still be cheap or expensive for other reasons. It is not cheap or expensive because of July’s U.S. average electricity. Compare that rental with the cost-per-token breakdown, which has to include the whole quote, and with the cluster TCO model, which has to include years of it.
The counterargument: large buyers do not pay the EIA average
A hyperscaler with a long-term power purchase, a behind-the-meter plant, or a state with a much lower industrial tariff does not pay 9.77 cents. The EIA average is pulled up by regions and by customers who do pay something like it. Using 9.77 cents as the cost of an electron in Quincy or in a nuclear-backed campus overstates that site and understates a site on a constrained grid with a high delivery charge. July itself was a high month relative to the 2026 year-to-date industrial average of 9.03 cents.
The objection changes the level and not the method. Replace 9.77 with the contract price in cents, keep the watts, and the hour cost follows. Until that contract price is in the model, the EIA series is the public floor for a U.S. comparison, with the preliminary-data caveat attached. A quote denominated in dollars per GPU-hour can be stacked next to $0.0684 or $0.1017 without pretending those cents are the invoice. If the quote is below the commercial ceiling cost, ask how the power is paid. If the quote is many times the ceiling cost, stop arguing about the utility and start arguing about the GPU, the utilization, and the term. Those are the variables in the procurement playbook.
What this analysis can’t tell you
It cannot tell you the watts a given job drew. Thermal design power is a ceiling, and the H200 table is marked preliminary. It cannot tell you a campus power-usage effectiveness, a demand charge, or a capacity reservation the utility bills whether or not the GPU runs. It cannot tell you the price in a particular state. Table 5.3’s national average hides that spread. It cannot tell you tokens per second, so it cannot tell you energy per token. Pairing these watt-hours with a throughput number requires a measured tokens-per-second figure on the same hardware. The MLPerf v6.1 per-GPU results are one such measurement, for the systems and stacks submitted, not for an H200 SXM at 700 watts.
July 2026 prices are preliminary. The EIA page lists the next update after the September 24, 2026 release as October 23, 2026. A revision of the July industrial price moves every dollar in this article in proportion. The 700-watt H100 figure is Meta’s description of the training GPUs, not an NVIDIA line item from the H200 page.
When to treat GPU electricity cost as the floor
Use the commercial ceiling, $0.1017 per hour at 700 watts, as the screening floor for a U.S. quote when you do not have the site’s tariff and the provider is not showing a power invoice. Use the industrial ceiling, $0.0684, only when the contract is actually on an industrial rate or you are modeling an owned meter you expect to look like the industrial average. If your measured average draw is half the ceiling, cut the floor in half rather than hunting a new price series.
A FinOps reviewer should reject a total-cost model that uses residential 18.31 cents for a colocation, and should reject one that uses 9.77 cents for a site whose contract is in hand and different. A platform lead sizing on-premise against cloud should put $599.10 per 700-watt GPU-year on the owned side only as the all-hours ceiling, then replace 8,760 with expected powered hours. A procurement lead comparing two quotes should subtract this floor before comparing the rest. The remainder is the number the negotiation can move. The cents-per-kilowatt-hour, until the next EIA revision, cannot.
FAQ
What is the GPU electricity cost of an H200 for one hour?
At the H200 SXM ceiling of 700 watts and the July 2026 U.S. industrial average of 9.77 cents per kilowatt-hour, one hour at the ceiling costs $0.0684. At the commercial average of 14.53 cents it costs $0.1017. The H200 NVL ceiling of 600 watts costs $0.0586 and $0.0872 on those two prices. This assumes the card draws the ceiling for the whole hour, and it excludes the rest of the building.
Why not use a single data-center electricity price?
The EIA does not publish one. It publishes sector averages, and it warns that commercial and industrial customers are classified by the utility, not by whether the building trains models. July 2026 industrial is 9.77 cents and commercial is 14.53 cents. A special contract can be outside both.
Does this include cooling?
No. Cooling and the rest of the building sit in a power-usage-effectiveness multiplier this article does not measure. Multiplying the industrial 700-watt hour by 1.2 or by 1.5, as a sensitivity only, produces $0.0821 or $0.1026. Those are not reported PUE values.
How much is a year at full power?
At 8,760 hours and 700 watts, the industrial average costs $599.10 and the commercial average costs $890.98. A card that is powered fewer hours, or that draws less than the ceiling, costs proportionally less. The year figure is an upper bound at the July price, not a forecast of the bill.
Can electricity explain a multi-dollar GPU-hour price?
Not at these U.S. averages. Ten cents an hour of commercial power at 700 watts is the entire nameplate energy cost. A quote of several dollars per GPU-hour is, at these prices, mostly recovery of the GPU, the building, the software, and the margin. Settle those before debating the utility average.
Sources & further reading
- U.S. Energy Information Administration, Electric Power Monthly, Table 5.3, average price by end-use sector through July 2026
- NVIDIA H200 product page, thermal design power and memory table, retrieved October 2, 2026
- Llama 3 team, “The Llama 3 Herd of Models,” arXiv:2407.21783, H100 TDP in the training description
Related reading
- AI data center power infrastructure
- GPU cluster TCO, on-premise versus cloud
- H200 vs B200 vs H100 cost per token
- Enterprise GPU procurement playbook
- MLPerf Inference v6.1 per GPU
Updated: October 2026. Electricity prices are preliminary EIA averages for July 2026. Watt figures are published ceilings, not a measurement made for this article. Facility overhead multipliers are labeled assumptions. This page is not a utility tariff and not a bid.

Author: Iovanny Olguín Ávila
Computer Systems Engineer with an MSc in Computer Science. I apply quantitative analysis and data-driven methodologies to evaluate financial instruments, investment vehicles, and emerging technologies. My technical background allows me to cut through marketing language and analyze the actual mechanics of financial products — from HELOC structures to Medicare Advantage plan design to business credit card reward algorithms.